
The 22 Essential B2B Sales Funnel Metrics Every Revenue Team Should Track in 2026

Your B2B sales funnel might be bleeding money right now, and you wouldn't even know it. Most revenue teams obsess over vanity metrics while the numbers that actually matter slip through the cracks. After building and optimizing dozens of B2B sales funnels at Growth Today using tools like Clay GTM, we've learned something crucial: the difference between thriving companies and struggling ones isn't talent or market timing—it's knowing which metrics actually drive growth.
According to Lead Forensics, companies with aligned teams generate 208% more revenue from marketing efforts. But here's the catch—that only happens when you're tracking metrics that actually matter, not just the ones that look good in board meetings.
This guide breaks down the 22 metrics that separate high-performing revenue teams from everyone else. Whether you're starting from scratch or fixing a broken system, you'll get actionable strategies for each metric that you can implement immediately.
Understanding the B2B Sales Funnel: Beyond the Basics

Your B2B sales funnel isn't the simple lead-to-customer pipeline from five years ago. Today's buyers are smarter, more cautious, and they research everything before talking to sales. Understanding comprehensive B2B sales KPIs isn't optional anymore—it's survival.
The Evolution of Modern B2B Sales Funnels
Here's what changed: The average B2B sales cycle now stretches beyond 100 days. Your prospects hit your website, download three pieces of content, attend a webinar, ghost you for two months, then suddenly book a demo. Traditional funnel tracking can't handle this chaos.
Modern B2B buyers don't follow your neat little funnel stages. They jump around, involve their entire team, and expect personalized experiences at every touchpoint. Your metrics need to reflect this reality.
Why Traditional Pipeline Metrics Fall Short
ScoreApp research reveals the average no-show rate hits 20-30% in B2B sales. That's just the tip of the iceberg. Legacy metrics miss the big picture:
- Multiple decision-makers who all need different information
- Prospects who research for months before engaging
- Content that influences deals but never gets credit
- Cross-channel journeys that traditional attribution can't track
The ROI of Measuring the Right Funnel Metrics
Want a number that'll get your attention? Dealfront found that a 5% bump in customer retention can more than double your revenue. Companies that nail their funnel measurement see immediate wins: better forecasts, smarter spending, and teams that actually hit their numbers.
The math is simple. Better metrics lead to better decisions. Better decisions drive better results.
Top-of-Funnel Metrics: Acquisition and Awareness
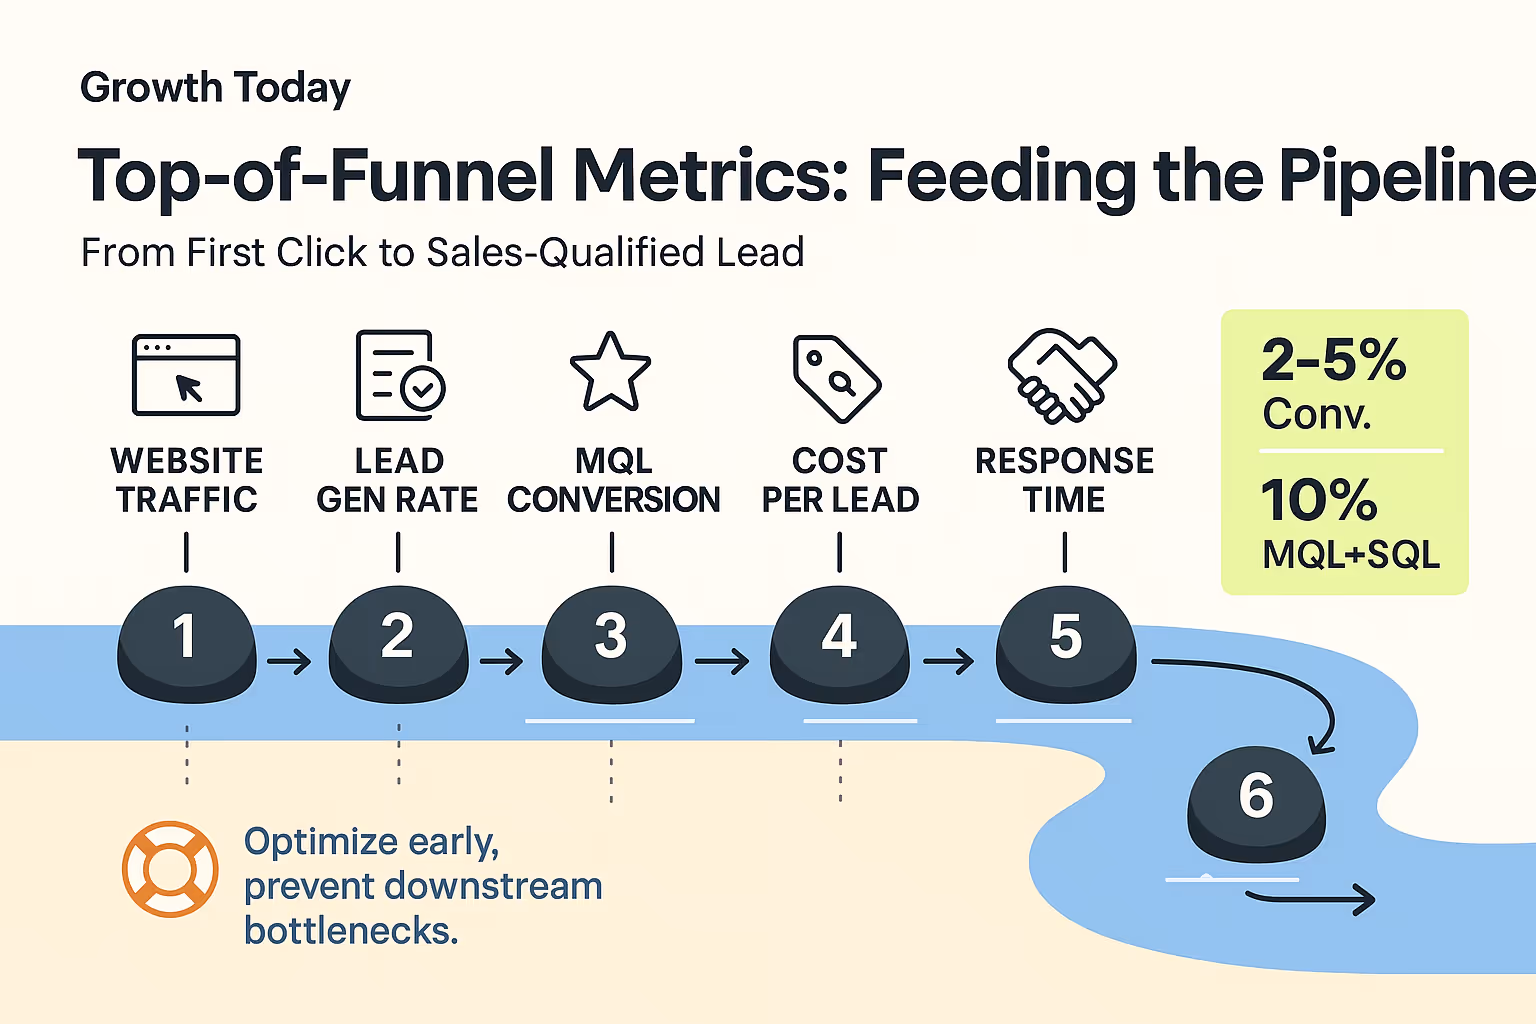
Your top-of-funnel metrics determine everything downstream. Mess up here, and you'll struggle with pipeline coverage for months. These metrics tell you whether you're attracting the right people and whether they're actually interested in what you're selling.
Getting this right starts with understanding your audience. Detailed B2B buyer persona research isn't just marketing fluff—it's the foundation of every metric that follows.
#1 Website Traffic and Source Attribution
Traffic without context is just a vanity metric. What matters is knowing which channels bring visitors who actually convert, and which ones just inflate your Google Analytics dashboard.
How to calculate: Traffic by source / Total traffic × 100
Track every source separately: organic search, paid ads, social media, direct visits, and referrals. But here's the key—focus on traffic that converts, not just volume. A thousand visitors from a viral LinkedIn post means nothing if none of them become customers.
Set up UTM parameters for everything. Every email, every social post, every ad. Your future self will thank you when you're trying to figure out which campaigns actually work.
#2 Lead Generation Rate
This metric separates websites that generate business from digital brochures. It measures how many visitors actually care enough to give you their contact information.
How to calculate: New leads / Total visitors × 100
B2B SaaS companies typically see 2-5% conversion rates, but don't get hung up on benchmarks. A 1% conversion rate from highly qualified traffic beats 10% from random visitors. Focus on improving the quality of your forms, landing pages, and offers.
Clay's automated lead enrichment kicks in the moment someone converts, giving you rich data to work with immediately.
#3 Marketing Qualified Lead (MQL) Conversion Rate
MQLs represent genuine interest, not just curiosity. These are prospects who fit your ideal customer profile and have shown meaningful engagement with your content.
How to calculate: MQLs / Total leads × 100
Tendril's industry data shows only 1-2% of new prospects become MQLs. That might sound low, but it's actually good news—it means your qualification process is working.
Build automated lead scoring that considers both demographic fit and behavioral signals. Someone who downloads your pricing guide and visits your integrations page scores higher than someone who just subscribed to your newsletter.
#4 Cost Per Lead (CPL)
CPL tells you what you're actually paying for each lead across all your marketing channels. This metric determines whether your acquisition strategy is sustainable or burning cash.
How to calculate: Total marketing spend / Number of leads
Enterprise B2B companies often see higher CPLs, but they also close bigger deals. The key is tracking CPL by channel so you can double down on what works and cut what doesn't.
Don't just look at averages. Your best-performing channel might have a higher CPL but generate leads that close at 3x the rate.
#5 Lead Response Time
Speed kills in B2B sales. The faster you respond to new leads, the higher your conversion rates. It's that simple.
How to calculate: Average time between lead creation and first contact
Best practice is responding within 5 minutes. Sounds impossible? Set up automated alerts and round-robin assignment. Your CRM should ping the right rep the moment a lead comes in.
Every minute you wait, your conversion rate drops. Every hour makes it exponentially worse.
#6 Marketing Qualified Lead to Sales Qualified Lead Ratio
This ratio reveals whether your marketing and sales teams are aligned on what constitutes a qualified lead. Poor conversion here usually means your qualification criteria are mismatched.
How to calculate: SQLs / MQLs × 100
Tendril research indicates MQL to SQL conversion should hit 10%. If you're way below that, either marketing is passing junk leads or sales isn't following up properly.
Want to boost your MQL to SQL conversion? Clay prospecting tools help you identify higher-quality leads from the start, so fewer leads slip through the cracks.
Middle-of-Funnel Metrics: Engagement and Qualification
Middle-funnel metrics show how well you're nurturing prospects and moving them toward purchase decisions. This is where deals get made or lost, often without anyone realizing it.
Understanding how to qualify B2B leads becomes critical here. Poor qualification wastes everyone's time and kills your conversion rates.
#7 Sales Qualified Lead (SQL) Conversion Rate
SQL conversion rate measures your overall lead quality from top to bottom. It's the ultimate test of whether your entire funnel is working.
How to calculate: SQLs / Total leads × 100
B2B SaaS companies typically see 5-15% SQL conversion rates. If you're below that range, look upstream—your targeting, messaging, or qualification process needs work.
Use BANT criteria (Budget, Authority, Need, Timeline) or similar frameworks, but automate the scoring. Manual qualification doesn't scale and creates inconsistencies.
#8 Opportunity Creation Velocity
Velocity measures how quickly SQLs become real opportunities. Slow velocity often indicates qualification bottlenecks or poor sales follow-up.
How to calculate: Average days from SQL to opportunity creation
Fast velocity suggests your qualification process is efficient and your sales team is responsive. Slow velocity? You've got process problems to fix.
Track this by rep and by lead source. Some channels might generate leads that move faster through your funnel.
#9 SQL-to-Opportunity Ratio
This ratio shows what percentage of qualified leads actually turn into sales opportunities. It's a direct measure of your qualification accuracy.
How to calculate: Opportunities created / SQLs × 100
Strong ratios typically range from 50-80%. Below 50% suggests you're over-qualifying or your sales team isn't following up effectively. Above 80% might mean you're under-qualifying and wasting time on weak opportunities.
#10 Engagement Score
Engagement scoring gives you a composite view of how interested prospects really are based on their behavior across all touchpoints.
How to calculate: Weighted activity scoring model based on engagement types
Build a scoring system that reflects reality. Email opens might be worth 1 point, but demo requests should be worth 10. Someone who visits your pricing page five times is more engaged than someone who opened your newsletter once.
#11 Sales Development Representative (SDR) Activity Metrics
SDR metrics track both quantity and quality of outbound activities. More calls don't always mean better results.
How to calculate: Activities per rep per day/week
Tendril data shows teams should aim for call-to-conversation ratios above 10%. Top performers connect with prospects 30% of the time or more.
Focus on conversations, not just dials. A rep who makes 50 calls and has 15 conversations beats someone who makes 100 calls and has 5 conversations.
#12 Demo-to-Meeting Conversion Rate
This metric reveals how effective your product demonstrations are at moving prospects to the next stage.
How to calculate: Next-stage meetings / Total demos × 100
Poor demo conversion usually means one of three things: weak qualification, poor demo skills, or inadequate follow-up. Set up automated confirmation sequences and follow-up workflows to improve attendance and conversion.
Bottom-of-Funnel Metrics: Conversion and Revenue
Bottom-funnel metrics are where the rubber meets the road. These numbers directly impact your revenue and determine whether your entire funnel strategy is working.
Understanding B2B sales cycle stages becomes crucial for optimizing these final conversion metrics.
#13 Win Rate
Win rate is the ultimate measure of sales effectiveness. It tells you what percentage of opportunities actually close.
How to calculate: Closed won opportunities / Total opportunities × 100
Tendril research shows SaaS companies average a 22% opportunity-to-conversion rate. Track win rates by rep, deal size, and lead source to identify what's working.
Low win rates often indicate poor qualification or weak sales processes. High win rates might mean you're not taking enough risks or your pipeline is too thin.
#14 Average Deal Size
Average deal size impacts everything from your sales strategy to your marketing budget. Bigger deals justify longer sales cycles and higher acquisition costs.
How to calculate: Total revenue from closed deals / Number of closed deals
Monitor trends over time. Growing deal sizes usually indicate better targeting or successful upselling. Shrinking deal sizes might mean increased competition or market pressure.
#15 Sales Cycle Length
Sales cycle length measures how long it takes to close deals from first opportunity to signed contract.
How to calculate: Average days from opportunity creation to deal closure
Tendril data indicates the average B2B sales cycle runs 2.1 months across industries, stretching to 2.5 months for SaaS companies. But this varies wildly—small business deals might close in 38 days while enterprise deals take 185 days.
Shorter cycles aren't always better. Sometimes a longer cycle means you're closing bigger, more strategic deals.
#16 Proposal-to-Close Ratio
This ratio measures how many formal proposals actually result in closed deals. It's a direct indicator of your proposal quality and pricing strategy.
How to calculate: Closed deals / Proposals sent × 100
Strong ratios typically range from 30-50%. Below 30% suggests pricing issues, poor proposal quality, or inadequate qualification before proposing.
#17 Forecast Accuracy
Forecast accuracy compares what you predicted to what actually happened. It's a measure of how well you understand your pipeline.
How to calculate: Actual revenue / Forecasted revenue × 100
Best-in-class organizations achieve 90%+ forecast accuracy. Poor accuracy indicates pipeline management problems, weak qualification, or wishful thinking.
#18 Revenue Attribution by Channel
Revenue attribution shows which channels actually drive closed business, not just leads or opportunities.
How to calculate: Channel revenue / Total revenue × 100
Use multi-touch attribution models to understand the full customer journey. The channel that gets the last click might not be the one that deserves the most credit.
Post-Sale Metrics: Retention and Growth
Post-sale metrics determine your long-term success. Acquiring customers is expensive—keeping them and growing their accounts is where the real money is made.
#19 Customer Churn Rate
Churn rate measures how many customers you lose over time. High churn kills growth and makes acquisition costs unsustainable.
How to calculate: Lost customers / Total customers × 100
SaaS companies should target monthly churn rates below 5%. Higher churn rates indicate product-market fit issues, poor onboarding, or inadequate customer success.
Set up automated churn prediction models to identify at-risk customers before they leave.
#20 Customer Lifetime Value (CLV)
CLV calculates the total revenue you expect from each customer relationship. It determines how much you can spend on acquisition.
How to calculate: Average revenue per customer × Average customer lifespan
Your CLV should exceed customer acquisition cost by at least 3:1 for sustainable growth. Higher CLV ratios enable more aggressive acquisition spending and justify enhanced customer success programs.
#21 Expansion Revenue Percentage
Expansion revenue comes from existing customers through upsells, cross-sells, and usage increases. It's often more profitable than new customer acquisition.
How to calculate: Expansion revenue / Total revenue × 100
Top SaaS companies achieve 20-30% expansion revenue rates. This metric reduces your dependence on new customer acquisition and improves your unit economics.
#22 Net Revenue Retention (NRR)
NRR measures revenue retained from existing customers including expansion minus churn. It's the ultimate measure of customer success.
How to calculate: (Starting period revenue + Expansion revenue - Churned revenue) / Starting period revenue × 100
Best-in-class companies achieve NRR rates exceeding 110%, meaning existing customers generate more revenue over time despite some churn.
Setting Up Your B2B Sales Funnel Metrics Dashboard
Building an effective dashboard requires the right tools, proper integrations, and smart automation. Your dashboard should provide real-time visibility while highlighting issues before they become problems.
Essential Tools for Tracking Funnel Metrics
Modern B2B sales teams need integrated tool stacks that automatically capture and report on funnel metrics:
CRM Platforms:
- Salesforce for enterprise customization and advanced reporting
- HubSpot for integrated marketing and sales tracking
- Pipedrive for straightforward pipeline management
Analytics and Reporting:
- Google Analytics for website and traffic metrics
- Mixpanel or Amplitude for product usage tracking
- Tableau or Power BI for advanced data visualization
Automation and Enrichment:
- Clay for automated lead enrichment and data quality
- Zapier for workflow automation between tools
- Outreach or SalesLoft for sequence tracking
Creating Real-Time Visibility with CRM Integration
Real-time dashboards eliminate manual reporting while providing instant insights. Key requirements include automated data sync between marketing and sales tools, consistent field mapping across systems, and API connections for real-time updates.
Automating Alerts for Funnel Leakage
Set up automated alerts for critical issues:
- Conversion rates dropping below historical averages
- Lead response times exceeding target thresholds
- Pipeline coverage falling below required ratios
- Individual rep performance deviating from team norms
Industry Benchmarks: How Do You Compare?
Benchmarks provide context for your performance, but remember—they vary significantly by industry, company size, and business model. Use them as guidelines, not gospel.
B2B SaaS Funnel Metrics Benchmarks
B2B SaaS companies have the most comprehensive benchmark data available:
Enterprise vs. SMB Sales Funnel Performance
Enterprise and SMB funnels work differently and require different benchmarks:
Enterprise B2B Characteristics:
- Longer sales cycles (6-18 months)
- Higher deal values ($50K-$500K+)
- Lower conversion rates but higher win rates
- More complex qualification requirements
SMB B2B Characteristics:
- Shorter sales cycles (1-3 months)
- Lower deal values ($1K-$50K)
- Higher conversion rates but lower win rates
- Simplified qualification processes
Vertical-Specific Conversion Standards
Different industries have unique characteristics that affect funnel performance:
- Healthcare: Extended cycles due to compliance requirements
- Financial Services: Higher security and approval thresholds
- Manufacturing: Complex procurement processes
- Technology: Faster adoption but higher churn rates
Common Sales Funnel Bottlenecks and How to Fix Them
Every funnel has bottlenecks. The key is identifying them quickly and fixing them systematically. Most bottlenecks stem from process issues, resource constraints, or team misalignment.
Diagnosing Top-of-Funnel Acquisition Problems
Top-funnel issues show up as declining lead quality, rising acquisition costs, or poor MQL conversion:
Common Problems:
- Targeting audiences that are too broad
- Weak value propositions in your content
- Poor landing page optimization
- Inadequate lead nurturing sequences
Solutions:
- Refine your ideal customer profiles and targeting
- A/B test messaging and content offers
- Optimize forms and calls-to-action
- Implement progressive lead nurturing campaigns
Resolving Middle-of-Funnel Qualification Issues
Middle-funnel bottlenecks appear as low SQL conversion rates, extended qualification times, or poor opportunity quality:
Common Problems:
- Misaligned qualification criteria between teams
- Inadequate lead scoring models
- Poor sales-marketing handoff processes
- Insufficient prospect engagement
Solutions:
- Align qualification criteria between marketing and sales
- Implement automated lead scoring systems
- Create structured handoff processes
- Develop targeted nurturing campaigns for different segments
Effective B2B lead nurturing strategies can dramatically improve middle-funnel conversion rates and deal quality.
Accelerating Bottom-of-Funnel Conversions
Bottom-funnel issues typically involve extended sales cycles, low win rates, or poor forecast accuracy:
Common Problems:
- Inadequate discovery and qualification processes
- Weak proposal and presentation processes
- Poor objection handling skills
- Insufficient follow-up and urgency creation
Solutions:
- Strengthen discovery methodologies and qualification frameworks
- Standardize proposal templates and presentation processes
- Develop comprehensive objection handling frameworks
- Implement systematic follow-up sequences with clear next steps
Advanced Funnel Analysis Techniques
Basic metrics tell you what happened. Advanced analytics tell you why it happened and what's likely to happen next.
Cohort Analysis for Funnel Optimization
Cohort analysis tracks groups of customers acquired during specific periods, revealing how funnel performance changes over time and identifying seasonal patterns.
Implementation Steps:
- Define cohort groupings (monthly, quarterly, by source)
- Track conversion rates for each cohort through the funnel
- Identify trends and anomalies across different cohorts
- Correlate performance changes with process modifications
Multi-touch Attribution Models
Multi-touch attribution provides more accurate revenue attribution by considering all touchpoints in the customer journey:
Attribution Models:
- Linear: Equal credit to all touchpoints
- Time Decay: More credit to recent touchpoints
- Position-Based: Higher credit to first and last touches
- Data-Driven: Machine learning-based attribution
Predictive Analytics for Pipeline Forecasting
Predictive analytics uses historical data and machine learning to forecast future performance:
- Deal closure probability scoring
- Churn risk identification
- Optimal follow-up timing recommendations
- Resource allocation optimization
Aligning Sales and Marketing Around Shared Funnel Metrics
Sales and marketing alignment isn't just nice to have—it's essential for funnel optimization. Misaligned teams create friction, waste resources, and miss revenue opportunities.
Developing a comprehensive B2B go-to-market strategy requires tight collaboration between sales and marketing around shared metrics and objectives.
Creating a Unified Funnel Measurement Framework
Unified frameworks eliminate discrepancies and ensure consistent reporting:
- Shared definitions for lead stages and qualification criteria
- Consistent attribution models across both teams
- Joint reporting dashboards and regular reviews
- Aligned compensation and incentive structures
Service Level Agreements (SLAs) Between Teams
SLAs establish clear expectations and accountability:
Marketing SLAs:
- Lead volume and quality commitments
- Response time requirements for sales requests
- Content and collateral delivery timelines
Sales SLAs:
- Lead follow-up time commitments
- Feedback requirements on lead quality
- Opportunity progression timelines
Joint KPIs for Revenue Team Success
Joint KPIs ensure both teams work toward shared revenue objectives:
- Pipeline Generation: Combined responsibility for opportunity creation
- Conversion Rates: Shared accountability for stage-to-stage progression
- Revenue Attribution: Joint tracking of closed revenue by source
- Customer Success: Shared responsibility for retention and expansion
Building a Data-Driven Sales Culture with Clay GTM Tool
Creating a data-driven culture requires more than just tools—it requires the right mindset, processes, and capabilities. Clay GTM provides the foundation for sophisticated funnel optimization.
Leveraging Clay for Enhanced Lead Generation
Clay's automation capabilities transform lead generation quality and efficiency:
- Automated prospect research and comprehensive data enrichment
- Real-time lead scoring and qualification
- Personalized outreach sequence automation
- Seamless integration with existing CRM and marketing tools
Optimizing Funnel Conversions with Clay's FETE Framework
Clay's FETE (Find, Enrich, Target, Engage) framework provides systematic funnel optimization:
- Find: Identify ideal prospects using advanced search and filtering capabilities
- Enrich: Enhance prospect data with comprehensive information
- Target: Segment prospects based on enriched data and behavioral signals
- Engage: Execute personalized outreach sequences at scale
Implementing the Jigsaw Methodology for Pipeline Growth
The Jigsaw methodology focuses on building comprehensive account maps and identifying multiple stakeholders:
- Map organizational structures and key decision-makers
- Identify influencers and champions within target accounts
- Develop multi-threaded engagement strategies
- Track engagement across all stakeholders and touchpoints
Enhanced B2B data enrichment tools enable more sophisticated account mapping and stakeholder identification for improved pipeline development.
Conclusion: From Metrics to Meaningful Revenue Growth
Tracking B2B sales funnel metrics isn't about having more dashboards or prettier reports. It's about building a predictable revenue engine that scales with your business.
The companies that win don't just measure their funnels—they use metrics to drive systematic improvements, align their teams, and build growth engines that compound over time. Start with the metrics that matter most for your current stage, implement proper tracking systems, and expand your capabilities as you grow.
Most importantly, remember that metrics are just the beginning. The real value comes from acting on what you learn, testing new approaches, and continuously optimizing your entire revenue process.
Ready to transform your B2B sales funnel with comprehensive metrics tracking and automation? Schedule a consultation to discover how our team can help you implement a data-driven revenue growth system tailored to your specific needs.
FAQs
What are the most important B2B sales funnel metrics for early-stage companies?
Early-stage companies should focus on customer acquisition cost (CAC), lead-to-customer conversion rate, sales cycle length, and monthly recurring revenue (MRR). Startup research indicates if your LTV divided by CAC is less than three, the business may not be viable because it takes too long to become cash flow positive.
How often should B2B sales funnel metrics be reviewed and updated?
Review key funnel metrics weekly for operational decisions and monthly for strategic planning. Quarterly reviews should focus on benchmark comparisons and process improvements. Critical metrics like lead response time and pipeline coverage need daily monitoring with automated alerts for immediate issues.
What's the difference between marketing qualified leads (MQLs) and sales qualified leads (SQLs)?
MQLs show interest through marketing activities but haven't been vetted by sales, while SQLs have been evaluated by sales and meet specific qualification criteria. Industry benchmarks show MQL to SQL conversion should hit 10%, with 1-2% of new prospects becoming MQLs initially.
How can automation improve B2B sales funnel metrics tracking?
Automation eliminates manual data entry, reduces errors, and provides real-time insights. Automated systems calculate metrics automatically, generate scheduled reports, and trigger alerts when performance deviates from targets. This enables faster response times and more accurate forecasting.
What are realistic conversion rate benchmarks for B2B sales funnels?
Conversion rates vary significantly by industry and business model. B2B SaaS companies typically see 1-2% of prospects becoming MQLs, 10% MQL to SQL conversion, and 22% opportunity-to-close rates. Adjust these benchmarks based on your specific market, deal size, and sales process complexity.
How do you measure ROI from sales funnel optimization efforts?
Measure ROI by comparing revenue improvements to optimization costs. Track metrics like increased conversion rates, reduced sales cycle length, and improved customer lifetime value. Research shows a 5% increase in customer retention can more than double your revenue, making funnel optimization investments highly valuable when executed properly.
Ready to accelerate your pipeline?
Reach out to discuss how we can help your GTM team scale with automation and expertise.